Data Visualization Courses
Data visualization courses can help you learn how to create compelling charts, graphs, and dashboards, along with understanding data storytelling and visual design principles. You can build skills in interpreting data trends, selecting appropriate visual formats, and conveying insights effectively to diverse audiences. Many courses introduce tools like Tableau, Power BI, and D3.js, that support transforming raw data into visual narratives and making data-driven decisions in various fields.
Popular Data Visualization Courses and Certifications

Skills you'll gain: Application Deployment, Cloud Deployment, UI Components, React.js, User Interface (UI) Design, JavaScript Frameworks, Web Design and Development, Cascading Style Sheets (CSS), Front-End Web Development, Content Management Systems, Amazon S3
 Status: Preview
University of Illinois Urbana-Champaign
Skills you'll gain: Descriptive Statistics, Statistical Inference, Sampling (Statistics), Histogram, Data Analysis, Probability & Statistics, Data Presentation, Statistical Analysis, Quantitative Research, Microsoft Excel, Statistical Methods, Probability Distribution, Graphing, Influencing
 Status: NewStatus: Free Trial
Skills you'll gain: Compliance Management, Microsoft 365, Compliance Auditing, Microsoft Azure, Governance Risk Management and Compliance, Data Governance, Cloud Security, Records Management, Data Loss Prevention, Personally Identifiable Information, Information Privacy, Threat Detection, Risk Management Framework, Cybersecurity, Digital Forensics, Data Security, Risk Management
 Status: NewStatus: Preview
Northeastern University
Skills you'll gain: Statistical Hypothesis Testing, Statistical Inference, Sampling (Statistics), Statistical Reporting, Statistical Methods, Probability & Statistics, Statistical Analysis, Experimentation, Data Analysis, Data Presentation, Estimation

Skills you'll gain: Pinterest, Content Creation, Social Media Content, Drive Engagement, Social Media Marketing, User Accounts, Digital Marketing
 Status: NewStatus: Preview
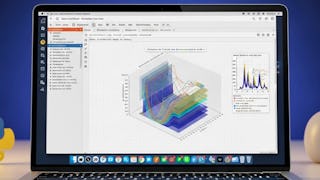
Skills you'll gain: Matplotlib, Scientific Visualization, Data Visualization Software, Interactive Data Visualization, Seaborn, Jupyter, NumPy, Performance Tuning, Development Environment, Python Programming, Debugging
 Status: Preview
Skills you'll gain: MLOps (Machine Learning Operations), Google Cloud Platform, Model Deployment, Data Governance, AI Workflows, Data Management, Predictive Modeling, Machine Learning, Model Evaluation, AI Orchestration, Data Pipelines, Performance Tuning
 Status: Free Trial
Skills you'll gain: 3D Assets, Computer Graphics, Technical Design, Visualization (Computer Graphics), Prototyping, Design Elements And Principles
 Status: New
Skills you'll gain: Full-Stack Web Development, Flask (Web Framework), Web Applications, Real Time Data, Web Development, Restful API, Application Development, Application Programming Interface (API), Back-End Web Development, Python Programming
 Status: Free Trial
Skills you'll gain: Artificial Intelligence and Machine Learning (AI/ML), Google Cloud Platform, Responsible AI, Data Quality, Cloud API, Big Data, Applied Machine Learning, Business Intelligence, Model Deployment, Natural Language Processing, Predictive Analytics
 Status: Free Trial
University of Colorado System
Skills you'll gain: Video Game Development, Game Design, Scripting Languages, Object Oriented Programming (OOP), Computational Logic, Data Structures, Computer Programming, Debugging
 Status: Preview
Skills you'll gain: Generative AI, Google Cloud Platform, MLOps (Machine Learning Operations), Prompt Engineering, Artificial Intelligence and Machine Learning (AI/ML), Cloud Infrastructure, AI Workflows, Big Data, Model Deployment, Machine Learning, Natural Language Processing
Searches related to data visualization
In summary, here are 10 of our most popular data visualization courses
- The Freelance Stack: Real project with NextJS and Strapi: Packt
- Untersuchen und Erstellen von Daten für Unternehmen: University of Illinois Urbana-Champaign
- Microsoft Compliance Solutions Capabilities: Whizlabs
- Engineering Probability and Statistics Part 2: Northeastern University
- Comment créer du contenu sur Pinterest: Coursera
- Jupyter & Python: Visualize, Optimize & Accelerate: EDUCBA
- Machine Learning in the Enterprise - Português Brasileiro: Google Cloud
- Blender Foundations & Tavern Structure Modeling: Packt
- Skill Up with Python: Web Development Recipes: Pearson
- Innovating with Google Cloud Artificial Intelligence - 日本語版: Google Cloud


